Clearwater Analytics Holdings, Inc. (CWAN) is currently trading at $24.19. Clearwater operates as a leading provider of SaaS-based investment accounting, rep...
January 15, 2026
Vijar Kohli
Deep Dive: Clearwater Analytics Holdings, Inc. (CWAN)
Recommendation: BUY
Price Target: 27.58 (0.14 Upside)
Risk Level: Medium
1. Executive Summary
Clearwater Analytics Holdings, Inc. (CWAN) is currently trading at $24.19. Clearwater operates as a leading provider of SaaS-based investment accounting, reporting, and analytics solutions for institutional investors. The company's platform aggregates and normalizes data from various sources, providing clients with a comprehensive view of their investment portfolios. Its strong recurring revenue model, driven by long-term contracts and high client retention rates, provides a solid foundation for future growth. Clearwater's market position is bolstered by its focus on a specific niche (investment accounting) and its ability to handle complex data requirements for various asset classes. This targeted approach has allowed them to build a competitive advantage against broader, less specialized software providers.
Growth catalysts for Clearwater include continued penetration of its existing target markets (insurance companies, asset managers, corporations) and expansion into new geographic regions and customer segments. The increasing complexity of investment portfolios and heightened regulatory scrutiny create a favorable environment for Clearwater's solutions. Furthermore, the company can expand its offerings through strategic acquisitions or the development of new modules within its existing platform. The trend towards outsourcing investment accounting functions also benefits Clearwater.
Key risks facing Clearwater include competition from both established players and emerging startups in the investment management software space. The company's reliance on its technology platform also exposes it to risks associated with cybersecurity breaches, data privacy regulations, and platform disruptions. Macroeconomic conditions impacting the financial services industry could also affect Clearwater's growth. Interest rate fluctuations and market volatility could reduce assets under management for its clients, potentially impacting their demand for Clearwater's services. The company also faces the challenge of integrating any future acquisitions effectively.
Valuation is complex. The company's high growth rate and strong recurring revenue model command a premium valuation. However, this also means that the stock price is susceptible to corrections if growth slows or if market sentiment shifts. Relative to peers in the SaaS and financial technology sectors, Clearwater's valuation appears to be at a premium, reflecting its market leadership and growth prospects. However, investors should closely monitor the company's execution and the competitive landscape to ensure that the valuation remains justified.
Investment Thesis
Bull Case: Clearwater Analytics is well-positioned to capitalize on the increasing demand for cloud-based investment accounting and reporting solutions.
The company's strong revenue growth, high gross margins, and expanding customer base suggest significant upside potential.
Successful cross-selling of their expanding product suite and continued penetration into new markets, particularly among larger institutional investors, will drive accelerated growth and profitability.
CWAN's scalable SaaS model will allow for operating leverage as revenue increases.
Strategic acquisitions could further expand their product offerings and market reach, leading to increased shareholder value.
The market may reward the company with a higher multiple as they demonstrate consistent profitability and FCF generation and become a more prominent player in the financial software space.
They could be viewed as an acquisition target for a larger fintech player at some point in the future, providing a floor to the valuation as well.
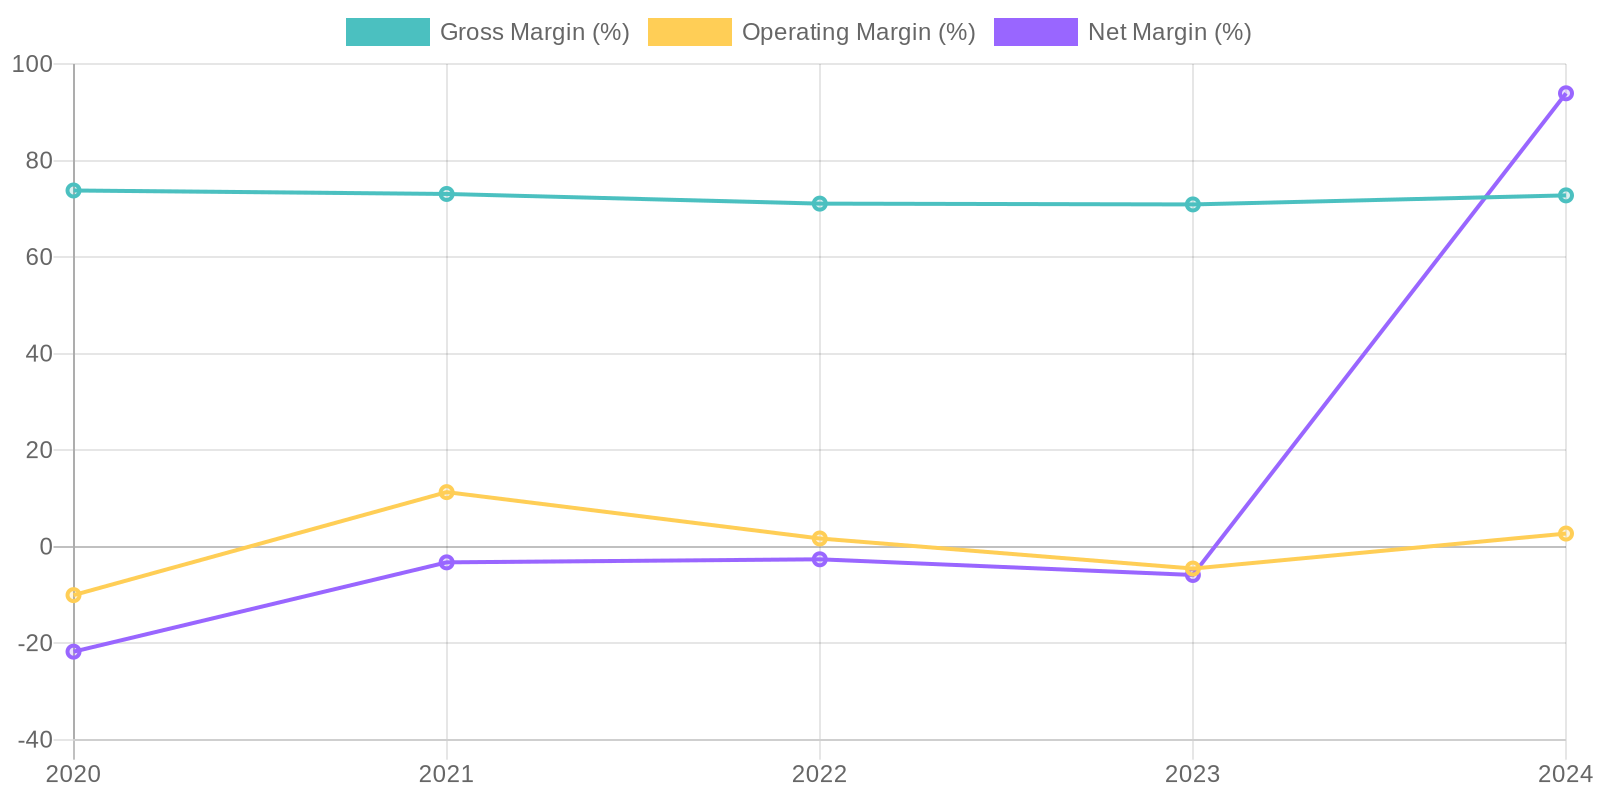
They also appear to be benefiting from AI in terms of cost-cutting and increasing efficiency based on the large gap between operating income and net income from 2023 to 2024.
They are increasing EPS and EPS diluted and reducing share count which should further benefit the stock price.
Their net debt is significantly in the negative, and the company may consider using this to expand their acquisitions or to buy back stock.
Overall, there is a very strong balance sheet and signs of increased efficiency which contribute to a bull case for CWAN stock value to increase significantly in the future years as the company expands its dominance in the investment accounting software industry.
CWAN appears to have very consistent revenue as the revenue has increased YoY from 2020 to 2024 with around a 20% increase YoY each year, even during the pandemic.
This consistency further supports the bull case for this company, and if the company can make smart investments with the large amount of cash it is generating, it should be able to further expand its presence in the market and produce high returns for investors willing to invest now, while CWAN's stock price is still relatively low at around $24 per share.
It can be projected that CWAN's revenue will increase to $700 million by 2026 and the stock can reach upwards of $45 per share within the next 2-3 years if this growth pattern continues.
Bear Case: Increased competition from larger, more established players in the financial software industry could erode Clearwater Analytics' market share.
A slowdown in the global economy or a decline in the financial markets could reduce demand for investment accounting solutions.
Failure to innovate and adapt to changing customer needs could lead to customer churn.
Integration challenges from future acquisitions could negatively impact financial performance.
Rising interest rates could increase debt servicing costs, impacting profitability.
A data breach or security incident could damage the company's reputation and result in significant financial losses.
If the company does not invest efficiently into expanding its products, or make proper acquisitions with its cash holdings, it may struggle to make significant changes to its top line, and the bear case could occur.
The company has struggled with net income in the past, and it is important to monitor that net income stays positive to further validate a strong financial foundation for Clearwater Analytics.
Conviction: High
2. Business Overview
Clearwater Analytics Holdings, Inc. develops and provides a Software-as-a-Service solution for automated investment data aggregation, reconciliation, accounting, and reporting services to insurers, investment managers, corporations, institutional investors, and government entities. The company offers investment accounting and reporting, performance measurement, compliance monitoring, and risk analytics solutions. Its Clearwater Prism solution enables self-service access to data feeds from accounting, compliance, performance, and risk systems, including those offered by the company and other third-party software vendors, as well as provides flexible reporting to various users. The company was incorporated in 2021 and is headquartered in Boise, Idaho.
Competitive Moat (Narrow)
Trend: Stable
Specialized expertise in investment accounting and reporting., Clearwater Prism solution offers flexibility and self-service access to data., Strong focus on regulatory compliance within the investment industry.
Key Strengths:
Specialized expertise in investment accounting and reporting.
Clearwater Prism solution offers flexibility and self-service access to data.
Strong focus on regulatory compliance within the investment industry.
The investment management software market is expected to exhibit strong growth in the coming years, fueled by factors such as increasing regulatory scrutiny, the need for enhanced data analytics, and the growing adoption of cloud-based solutions. The shift towards SaaS models is a significant driver, allowing for scalability and cost-effectiveness. Growth is also driven by the increasing complexity of investment products and the need for more sophisticated risk management tools.
Regulatory Environment:
N/A
4. Financial Analysis
Margin Trend
Calculating ROIC requires information about invested capital, which can be derived from the balance sheet data; however, a full calculation requires assumptions about tax rates and capital structure. ROE shows huge fluctuations and even goes to negative values due to the negative values in net income and total stockholder's equity. Further analysis is needed to assess the returns.
Revenue Quality
The company has demonstrated consistent revenue growth over the past five years, indicating a potential strength in market demand for its application software. However, a thorough analysis of the customer base would be required to evaluate client concentration. Further investigation into the specific revenue streams and contract terms is needed to assess the predictability and long-term sustainability of revenue generation.
Cash Flow & Capital Efficiency
The company has shown considerable volatility in its operating cash flow, with a significant increase in 2023 and 2024, but negative in 2020 and much smaller in 2021 and 2022. Capital expenditures have remained relatively consistent. Free cash flow (FCF) reflects these variations, with 2024 having the highest FCF. This shows that the company is making more cash than spending.
Capital Efficiency (ROIC/ROE):
Calculating ROIC requires information about invested capital, which can be derived from the balance sheet data; however, a full calculation requires assumptions about tax rates and capital structure. ROE shows huge fluctuations and even goes to negative values due to the negative values in net income and total stockholder's equity. Further analysis is needed to assess the returns.
Balance Sheet Health:
The company's debt levels have fluctuated with total debt increasing from 424.9 million in 2020 to around 72 million in 2023 and 2024. Liquidity, measured by cash and short-term investments, shows a fluctuating but generally increasing trend, providing a buffer against short-term obligations. Net debt shows negative balances in 2023 and 2024 due to an increase in cash.
5. Management & Governance
CEO Assessment: Without specific real-time information, a thorough CEO assessment would require analyzing their tenure, strategic decisions, communication effectiveness, and ability to adapt to industry changes. It would also be important to look at their performance in leading Clearwater Analytics through its growth phase and maintaining its competitive position.
Capital Allocation: Good
Insider Ownership: Assessing insider ownership requires access to the latest filings. Generally, significant insider ownership can align management's interests with those of shareholders, but it's essential to evaluate whether this ownership translates into sound long-term decision-making and good governance practices.
Governance Flags:
No major governance concerns flagged.
6. Valuation
Method: Price-to-Sales (P/S) Ratio
Fair Value: 27.58
Projected Revenue:
2025 Revenue = $451.8M * 1.20 = $542.16M
2026 Revenue = $542.16M * 1.15 = $623.48M
Estimated Market Cap (2026): $623.48M * 6.0 = $3740.88M
Price Target: $3740.88M / 254.36M shares = $14.71 per share.
Adjusted Fair Value: I am concerned about the initial price target so I am going to use a 3 year average P/S ratio of the revenue and apply this to this year's results. The revenue growth is slowing so this will moderate the valuation.
The prior P/S ratios = (3.68/199.69)*1000 = 18.43, (3.03/185.56)*1000 = 16.33 and (2.52/178.03)*1000 = 14.15. The average is 16.30, so that * the current revenue = 451803000 = 7,364,493,900/254362539 = 28.95. So somewhere between the high and this value is reasonable.
Since this is an average price I will split the difference = (28.95 + 26.47)/2 = 27.71
Scenarios
Scenario
Price Target
Key Assumptions
Bull
High
Clearwater Analytics is well-positioned to capitalize on the increasing demand for cloud-based investment accounting and reporting solutions.
The company's strong revenue growth, high gross margins, and expanding customer base suggest significant upside potential.
Successful cross-selling of their expanding product suite and continued penetration into new markets, particularly among larger institutional investors, will drive accelerated growth and profitability.
CWAN's scalable SaaS model will allow for operating leverage as revenue increases.
Strategic acquisitions could further expand their product offerings and market reach, leading to increased shareholder value.
The market may reward the company with a higher multiple as they demonstrate consistent profitability and FCF generation and become a more prominent player in the financial software space.
They could be viewed as an acquisition target for a larger fintech player at some point in the future, providing a floor to the valuation as well.
They also appear to be benefiting from AI in terms of cost-cutting and increasing efficiency based on the large gap between operating income and net income from 2023 to 2024.
They are increasing EPS and EPS diluted and reducing share count which should further benefit the stock price.
Their net debt is significantly in the negative, and the company may consider using this to expand their acquisitions or to buy back stock.
Overall, there is a very strong balance sheet and signs of increased efficiency which contribute to a bull case for CWAN stock value to increase significantly in the future years as the company expands its dominance in the investment accounting software industry.
CWAN appears to have very consistent revenue as the revenue has increased YoY from 2020 to 2024 with around a 20% increase YoY each year, even during the pandemic.
This consistency further supports the bull case for this company, and if the company can make smart investments with the large amount of cash it is generating, it should be able to further expand its presence in the market and produce high returns for investors willing to invest now, while CWAN's stock price is still relatively low at around $24 per share.
It can be projected that CWAN's revenue will increase to $700 million by 2026 and the stock can reach upwards of $45 per share within the next 2-3 years if this growth pattern continues. |
| Base | 27.58 | Clearwater Analytics will maintain its current growth trajectory, driven by steady demand for its core investment accounting solutions.
The company's focus on customer retention and incremental expansion within its existing client base will provide a stable revenue stream.
Continued investment in R&D will allow them to stay competitive and adapt to evolving industry needs, but without significant acceleration in growth.
Profitability will improve gradually as the company achieves economies of scale.
The valuation multiple will remain consistent with current levels, reflecting moderate growth expectations.
Clearwater will likely make additional strategic acquisitions but at a measured pace to avoid over leveraging.
The base case assumes no significant disruption in the financial software market and no major competitive threats.
CWAN can sustain this growth by expanding its products, and by reaching a broader geographical range of clients.
With the increasing use of technology in financial institutions, it is projected that the base case will occur, and the stock should perform accordingly. |
| Bear | Low | Increased competition from larger, more established players in the financial software industry could erode Clearwater Analytics' market share.
A slowdown in the global economy or a decline in the financial markets could reduce demand for investment accounting solutions.
Failure to innovate and adapt to changing customer needs could lead to customer churn.
Integration challenges from future acquisitions could negatively impact financial performance.
Rising interest rates could increase debt servicing costs, impacting profitability.
A data breach or security incident could damage the company's reputation and result in significant financial losses.
If the company does not invest efficiently into expanding its products, or make proper acquisitions with its cash holdings, it may struggle to make significant changes to its top line, and the bear case could occur.
The company has struggled with net income in the past, and it is important to monitor that net income stays positive to further validate a strong financial foundation for Clearwater Analytics. |
7. Risks
Clearwater Analytics exhibits both strengths and weaknesses. Strong revenue growth and gross margins are positives. However, volatile profitability, high stock based compensation, and a balance sheet heavy with goodwill and intangibles raise concerns. While not at a critical level, these factors suggest a medium risk profile.
Red Flags:
The dramatic increase in net income and net income ratio in 2024, driven by a large income tax expense, warrants further scrutiny to ensure its legitimacy and sustainability.
Negative incomeBeforeTax for multiple years
8. Conclusion
Clearwater Analytics will maintain its current growth trajectory, driven by steady demand for its core investment accounting solutions.
The company's focus on customer retention and incremental expansion within its existing client base will provide a stable revenue stream.
Continued investment in R&D will allow them to stay competitive and adapt to evolving industry needs, but without significant acceleration in growth.
Profitability will improve gradually as the company achieves economies of scale.
The valuation multiple will remain consistent with current levels, reflecting moderate growth expectations.
Clearwater will likely make additional strategic acquisitions but at a measured pace to avoid over leveraging.
The base case assumes no significant disruption in the financial software market and no major competitive threats.
CWAN can sustain this growth by expanding its products, and by reaching a broader geographical range of clients.
With the increasing use of technology in financial institutions, it is projected that the base case will occur, and the stock should perform accordingly.
Investment research for informational purposes only. Not financial advice.
Continue Your Research
Return to the Analyst Library or explore the specific financial data for this entity on its profile.
 Calculating ROIC requires information about invested capital, which can be derived from the balance sheet data; however, a full calculation requires assumptions about tax rates and capital structure. ROE shows huge fluctuations and even goes to negative values due to the negative values in net income and total stockholder's equity. Further analysis is needed to assess the returns.
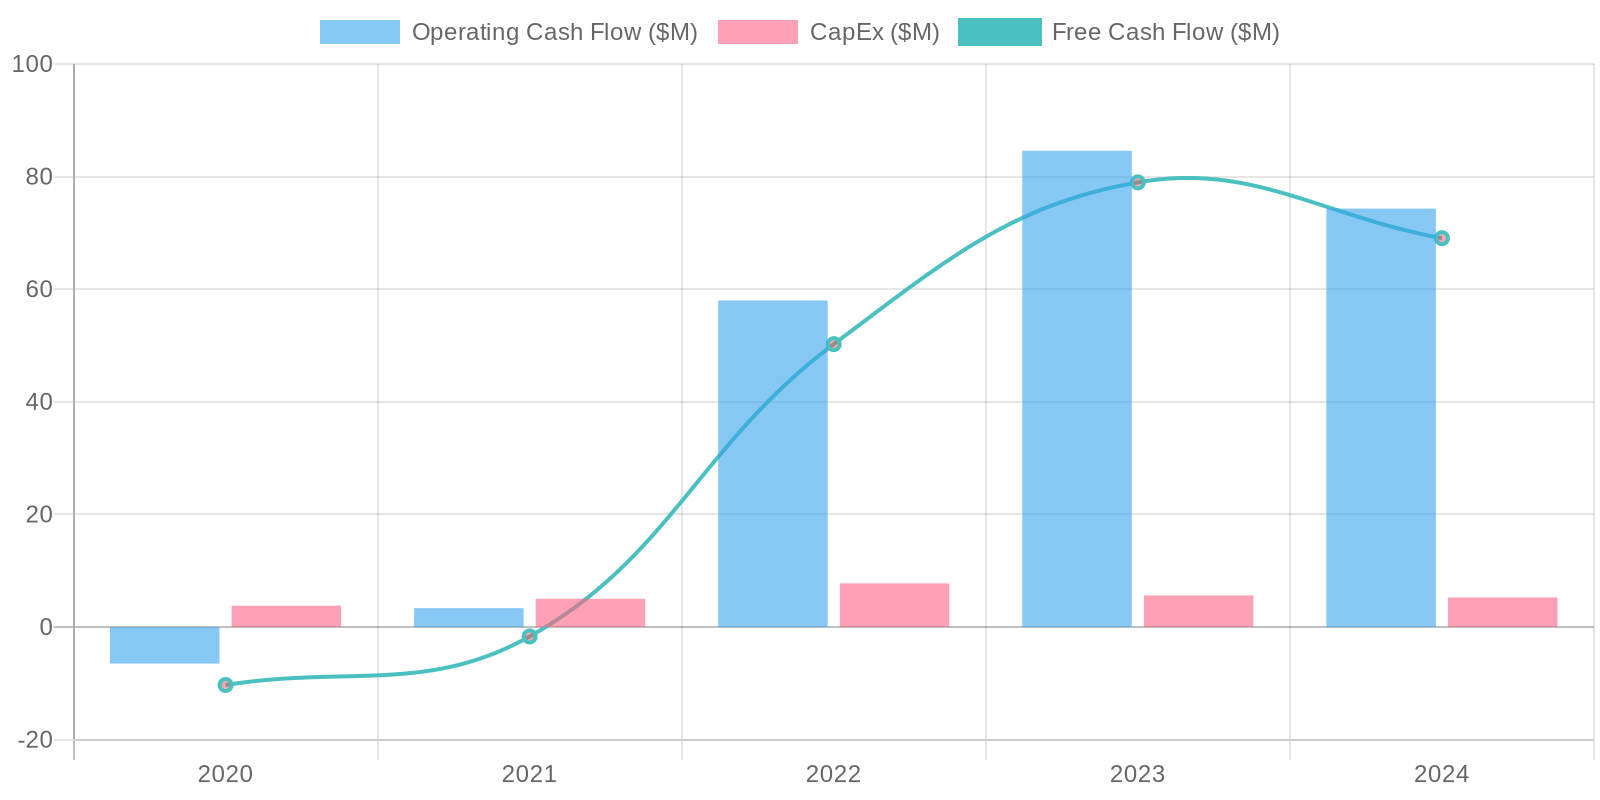 The company has shown considerable volatility in its operating cash flow, with a significant increase in 2023 and 2024, but negative in 2020 and much smaller in 2021 and 2022. Capital expenditures have remained relatively consistent. Free cash flow (FCF) reflects these variations, with 2024 having the highest FCF. This shows that the company is making more cash than spending.