Golden Door Asset
BenchmarkResearchFinancials
Sign InFull Access

Golden Door Asset

Public software investment firm focused on durable compounders, supported by our software quality ratings and research.

Ratings & Research

  • Research Library
  • R&D Benchmark
  • Methodology
  • Financial Model
  • Investment Mandate
  • Full Access

Company

  • About Us
  • Member Hub
  • Member Sign In
  • Contact Us

Legal

  • Privacy
  • Terms
© 2026 Golden Door Asset. All rights reserved.
Loading equity research...

Golden Door Asset · Investment Committee Research Brief

Nutanix, Inc.

Published Oct 31, 2026 · Data as of Oct 31, 2026

Research Library/NTNXNutanix, Inc.
NTNX Model →

NTNX · Research

Nutanix Handed Back Every Dollar of Owner Cash, and Customers Prepaid Two Thirds of It

By Vijar Kohli

Nutanix turned the VMware exodus into 15.8% ARR growth and $483.0M of owner cash in fiscal 2026. It spent $483.5M on buybacks, and $315.0M of that cash came from customers paying ahead.

59.42·NeutralAs of Nov 8, 2026▼ -9.7 YoY#41 RatedResearchPublished Oct 31, 2026 · Data as of Oct 31, 2026· 1 min read · 1 exhibitUpdated
Annual recurring revenue growth
15.8%

FY2026

Owner cash
$483M

FY2026

Share of owner cash from prepayments
65.2%

FY2026

$2,853.5M

$NTNX Key Figures
FigureValue
Revenue, FY2026$2,853.5M
Operating cash flow, FY2026$916.7M
Buybacks, FY2026$483.5M
Stock pay, FY2026$357.7M
End customers, Jul 31, 2026Over 32,000
Total deferred revenue, Jul 31, 2026$2,423.4M
Convertible notes, Jul 31, 2026$1,362.5M

Source: Nutanix for fiscal year ended Jul 31, 2026; Q4 FY2026 release, Aug 26, 2026

Golden Door Researchgoldendoorasset.com

$NTNX key figures, latest filings.
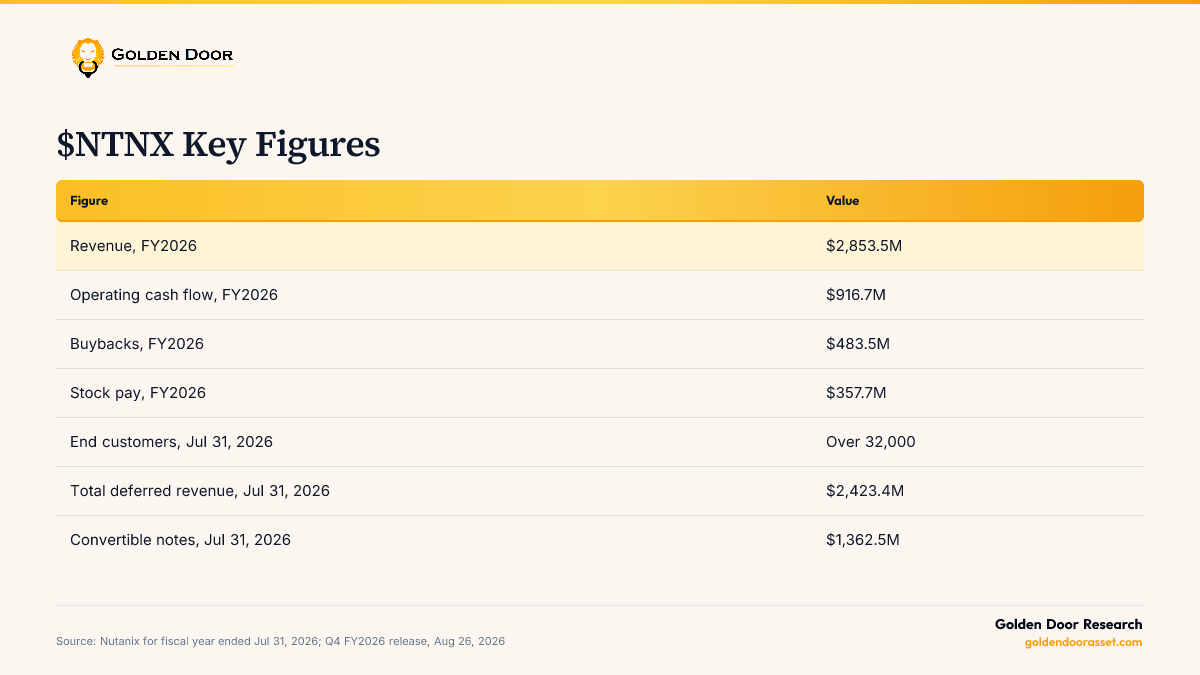
Nutanix ($NTNX) Key Figures
$NTNX key figures, latest filings.

1. Summary: what this piece answers

Nutanix sells the software layer that virtual machines, containers and now inference workloads run on, inside a company's own data centers and in public clouds. This piece asks one question: in fiscal 2026, the year after Broadcom repriced VMware, did Nutanix turn the migration wave into durable owner cash, or did it mostly hand cash back while customers prepaid for the future?

Here is what you will learn. Revenue grew 12.44% to $2,853.5M and annual recurring revenue grew 15.8% to $2.55B [1][2].

Operating cash flow was $916.7M. After $76.0M of capex and $357.7M of stock pay, owner cash was $483.0M, or 16.93% of revenue, our calculation [1].

In the same year Nutanix spent $483.5M on buybacks, 100.1% of owner cash, our calculation [1]. And $315.0M of operating cash, 65.2% of owner cash, came from a rise in deferred revenue, meaning customers paid ahead for multi-year subscriptions [1].

The headline net income of $1,506.8M is mostly an accounting event. Nutanix released $1,208.2M of its tax valuation allowance, which produced a $1,179.7M tax benefit [1].

Pre-tax income was $327.1M, or 11.5% of revenue [1]. Our view: the business is real and improving, but the cash that funds buybacks is leaning on prepayments, and the cash that remains once those are stripped out is smaller than the headline suggests.

NTNX Model

On this page

  1. 1. Summary: what this piece answers
  2. 2. Thesis and the toll-gate test
  3. 3. What Nutanix sells
  4. 4. How each line makes money, customers and pricing
  5. 5. Growth
  6. 6. Retention and the proxy we use
  7. 7. Operations: segments, costs, headcount and efficiency
  8. 8. Cash flow and owner cash
  9. 9. Balance sheet and capital allocation
  10. 10. Acquisitions
  11. 11. Superintelligence angle
  12. 12. Leadership and control
  13. 13. Risks and catalysts
  14. 14. Scorecard, questions and predictions
Unlock the full note with Full Access

$1,000/yr. The full notes, valuation, exhibits, risks, archive and exports across 130 stocks.

Full Access

Golden Door Membership

Unlock the full institutional underwriting, Bear/Base/Bull valuation cases, exhibits, and permanent research archive across 130 software companies.

Remaining in this NTNX report (13 sections, ~1,350 words)+5 exhibits
  1. 1.2. Thesis and the toll-gate test
  2. 2.3. What Nutanix sells
  3. 3.4. How each line makes money, customers and pricing
  4. 4.5. Growth
  5. 5.6. Retention and the proxy we use
  6. 6.7. Operations: segments, costs, headcount and efficiency
  7. 7.8. Cash flow and owner cash
  8. 8.9. Balance sheet and capital allocation
  9. 9.

Sources

  1. [1]Nutanix, Form 10-K for the fiscal year ended Jul 31, 2026, filed Sep 18, 2026.
  2. [2]Nutanix, Form 8-K Exhibit 99.1, fourth quarter and fiscal 2026 results, filed Aug 26, 2026.
  3. [3]Nutanix, Form 8-K (Item 2.05), workforce reduction, filed Aug 4, 2026.
  4. [4]Nutanix, Form 8-K (Item 5.02), President and Chief Commercial Officer departure, filed Sep 24, 2026.
  5. [5]Nutanix, Form 8-K (Item 5.02), transition advisory agreement, filed Oct 7, 2026.

Company Profile

NTNX Stock Profile →
NTNXNutanix, Inc.

Related Coverage & Peer Deep-Dives

View All →
MSFT67.13 · StrongSector Peer
Free summary

Claude Sheets Still Sends Serious Work Back to Excel, but Microsoft's Owner Cash Fell 46.64% in Two Years and Its Market Value Assumes 57% Yearly Growth

Anthropic's new sheets still send serious work back to Excel, but owner cash after capex and stock pay fell 46.64% in two years and the market value assumes about 57% yearly growth.

Microsoft CorporationNov 14, 2026 · Data as of Nov 14, 2026
← All Research LibraryMore NTNX Research →
NTNX Model →
10. Acquisitions
  • 10.11. Superintelligence angle
  • 11.12. Leadership and control
  • 12.13. Risks and catalysts
  • 13.14. Scorecard, questions and predictions
  • Locked analytical exhibits (5)

    GAAP Net Profit Bridge & 5x5 Sensitivity Matrix
    GAAP Net Profit Bridge
    5x5 Sensitivity Matrix
    Bear/Base/Bull Valuation & RisksAll Exhibits & Financial Schedules130-Stock Archive & CSV Exports
    Get Full Access→
    Instant web & archive accessMember Sign In

    Not ready yet? Get the free opening of each weekly research note by email.

    DT72.02 · StrongSector Peer
    Free summary

    Dynatrace: Profitable Enterprise Observability

    Dynatrace combines 21.4% TTM revenue growth and 81.1% gross margin with positive 12.7% GAAP operating margin and $578.7M of GAAP FCF.

    Dynatrace, Inc.Nov 8, 2026 · Data as of Sep 30, 2026
    IOT67.36 · StrongSector Peer
    Free summary

    Samsara Owns the Data Coming Off the Truck but Stock Pay Still Swallows the Cash Shareholders Keep

    Samsara's recurring revenue grew 30% to $2,124.7M, but cash left for shareholders was negative $75.1M over the twelve months to Aug 1, 2026.

    Samsara Inc.Oct 31, 2026 · Data as of Oct 31, 2026
    Industry ResearchIndustry Research
    Golden Door

    Clouds Own the Servers. Database Renters Kept the Margin.

    Microsoft (MSFT) and Oracle (ORCL) lost between 2.4 and 9.86 points of cloud margin in their latest quarter as new data center capacity came online, while Snowflake (SNOW), MongoDB (MDB) and Elastic (ESTC) held gross margins of roughly 71% to 77% on infrastructure they rent from those same clouds. Owning servers turns every new data center into depreciation that lands before the revenue does; renting turns it into a usage bill that grows with the customer.

    Golden Door AssetNov 21, 2026 · Data as of Nov 21, 2026